Kajakai Dam, Afghanistan

Public Domain Photo:Kajakai Dam
Kajakai dam, built by Morrison-Knudsen Co. Photo by the United States AID.

Creative Commons Photo:
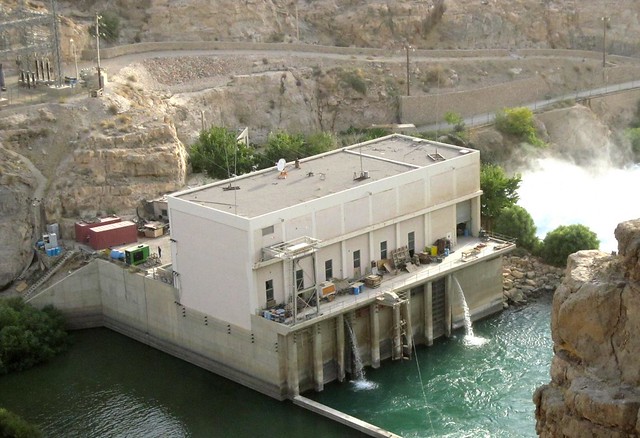
Powerhouse
Citation:
Kajakai dam powerhouse. Photo by the United States Army Corps. of Engineers Public Affairs office
. used under creative commons license.

VW

VW photo by sicoactiva, copyrighted through Flickr Creative Commons

posted by Anna, April, Kyle

Agent Childers and Seized Mink Skins

Public Domain Image

Agent Childers and Seized Mink Skins by Freimuth DC, U.S. Fish and Wildlife Service from Public-Domain-Image.com

Creative Commons Image

Luna in Denial by Beverly and Pack under a Creative Commons License

Post by Eric Schooley and Ryan Regis

Woolwich Dock, Sydney – April, Kyle, Anna

Woolwich Dock, Sydney photo by Australian National Maritime Museum on The Commons, No known copyright restrictions.

Recent Look at the United States Murder Rate

We compare and analyzed from different websites the geography and rate of violent crimes within the United States.  We divided characteristics of crime rates giving on the United States Census Bureau’s statistics of certain crimes within major minor and rural metropolitan cities.

“Questions like what rates in and outside of metropolitan cities were higher for what crimes?” were asked.

Data, visuals, and visualization (September 17)

Resources for in-class discussion

Map of Salem Village and map of witchcraft accusers and accused

Cholera in London

Napoleon’s invasion of Russia in 1912

On the Origin of Species: The Preservation of Favoured Traces

Animal City

Digitally reconstructing Washington, DC as it appeared circa 1814

Chronozoom project

Name Voyager and Name Mapper

Questions

1. How might a humanist approach or use data sets differently than a scientist would?

2. Why might historians want to create visualizations?

3. What are the advantages and liabilities (for historians and their audiences) of transforming data into visualizations?

4. Which of the visualizations in the reading, or at the links above, do you find particularly interesting or persuasive, and why?  Which ones are less interesting or persuasive?

An in-class exercise

1. Find online either (a) sources that you could convert into data or (b) an existing dataset drawn from primary sources.

2. What questions might an historian ask of this data?

3. What methods might the historian use to make sense of this data?

4. What kind(s) of visualization(s) do you think would be most useful to (a) the historian as she conducts her analysis and (b) the audience for her work?

5. Post your responses to these questions, along with a link to the data or dataset you used in your example, to the course blog.  In the category list, check the box for “data experimentation.”  Be sure to include the first names of everyone in your group.